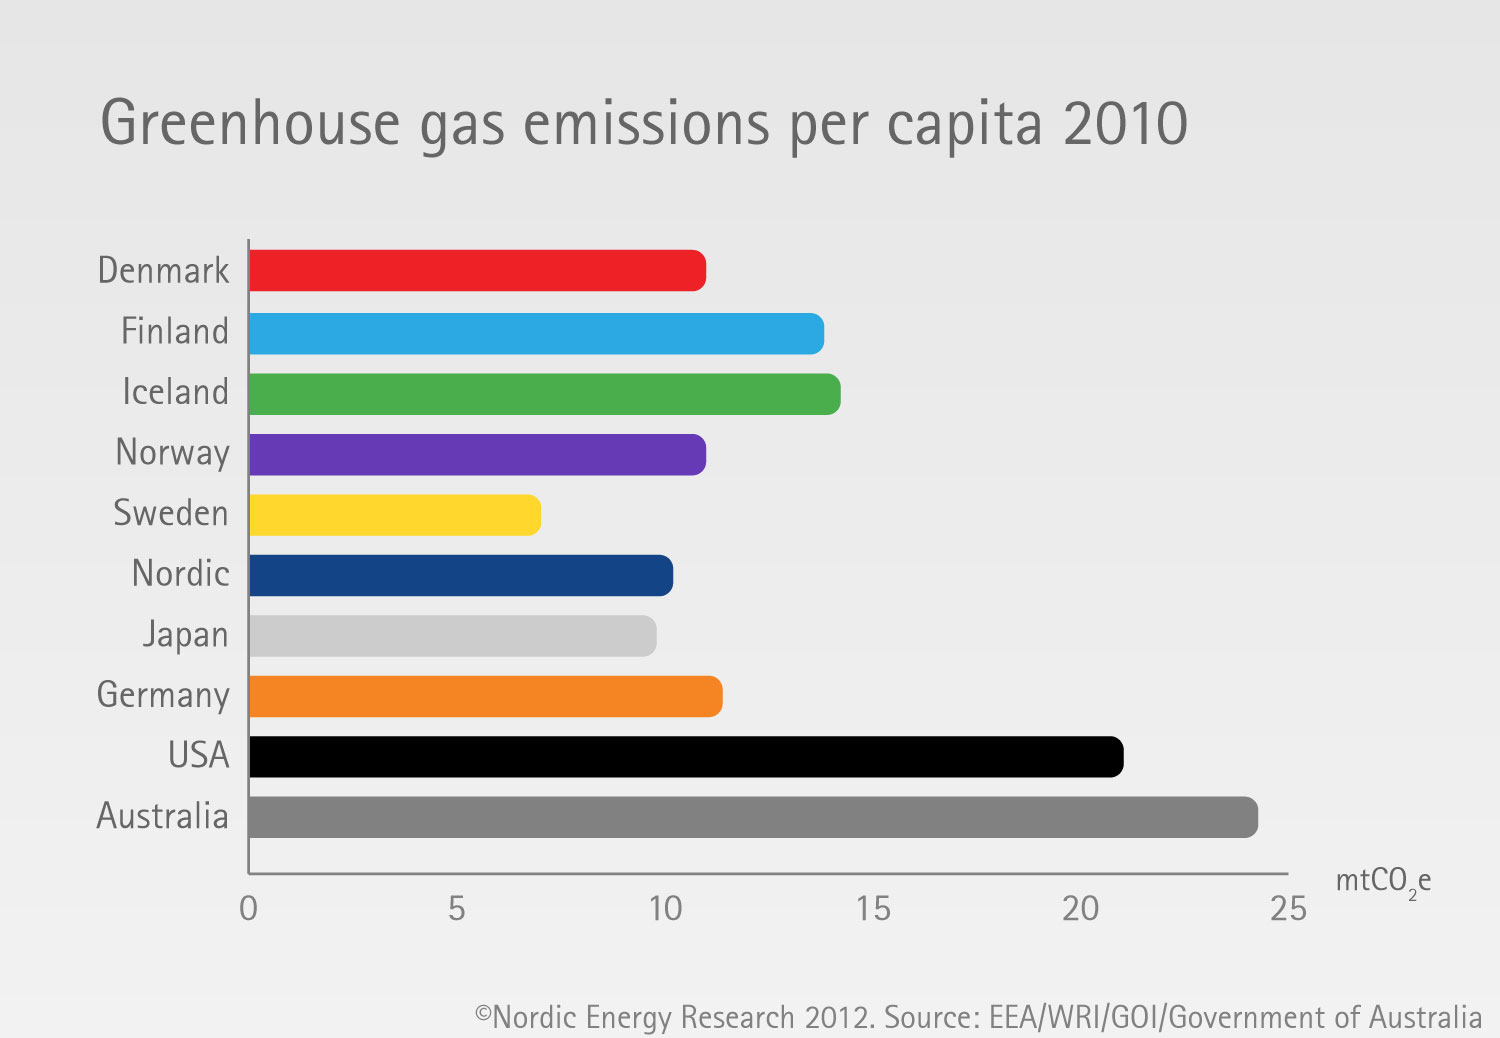
Despite having a relatively decarbonised electricity supply, the Nordic region has slightly higher per capita Greenhouse Gas (GHG) emissions than other industrialised countries in Europe and Asia. This is due in part to the cold climate and prevalence of energy-intensive industry. The Nordic countries have set ambitious targets for emissions reductions by 2050.
Danish emissions are influenced by its relatively carbon-intensive electricity production compared to other countries, but counteracted by its lack of energy-intensive industry. Denmark has been among the most successful countries at decoupling emissions and energy use from economic growth. The Danish economy has grown by 78% since 1980, while CO2 emissions have reduced. This development reflects an increase in energy efficiency, and increased use of wind and biomass in electricity and heat production (1).
Finnish per capita emissions are among the highest in the region, due to the use of fossil fuels in its electricity mix and its significant industrial activity. Industry is the largest energy end-use sector in Finland, with paper, pulp, metal and chemical being the main industrial energy consumers (2).
Iceland’s per capita emissions are the highest in the region, and have a unique composition. With no railways and a low population density, almost 80% of emissions stem from transport and fishing vessels. Process emissions from aluminium production plants have the most significant impact on emissions after transport. Emissions from generation of electricity and from heating are very low owing to the exclusive use of renewable energy sources (geothermal and hydropower).
Norway’s relatively high per capita energy consumption is offset by its renewable supply of electricity. However, significant petroleum extraction accounts for about 16% of the country’s emissions. The exported oil and gas are not counted as part of Norwegian emissions. If they were, total emissions would be more than ten times as high. On the other hand, if deforestation was included, Norway’s emissions would be halved, while Indonesia and Brazil become two of the world’s five largest emission countries (3). Should emissions associated with imported goods (from China for example) be included, the emissions from all Nordic countries would grow significantly.
Sweden’s per capita greenhouse gas emissions are the lowest in the Nordic region. They have been reduced significantly in the last decades, despite economic growth. The two most important factors in this reduction have been the introduction of nuclear power in the 1980s an a change-over from oil to biofuels in the production of district heat. While Swedish per capita emissions are low in comparison with other developed countries, they are significantly higher than most developing countries.
Notes: Figure shows metric tonnes of CO2 equivalent per capita. All numbers are from 2010, except for the US (2009).
Data sources: EEA, World Resource Institute, Greenhouse Gas Inventory Office of Japan, the Australian government.
Text sources: (1) The Danish Ministry of Climate and Environment , (2) Cordis, (3) The Norwegian Government.
